

반응형
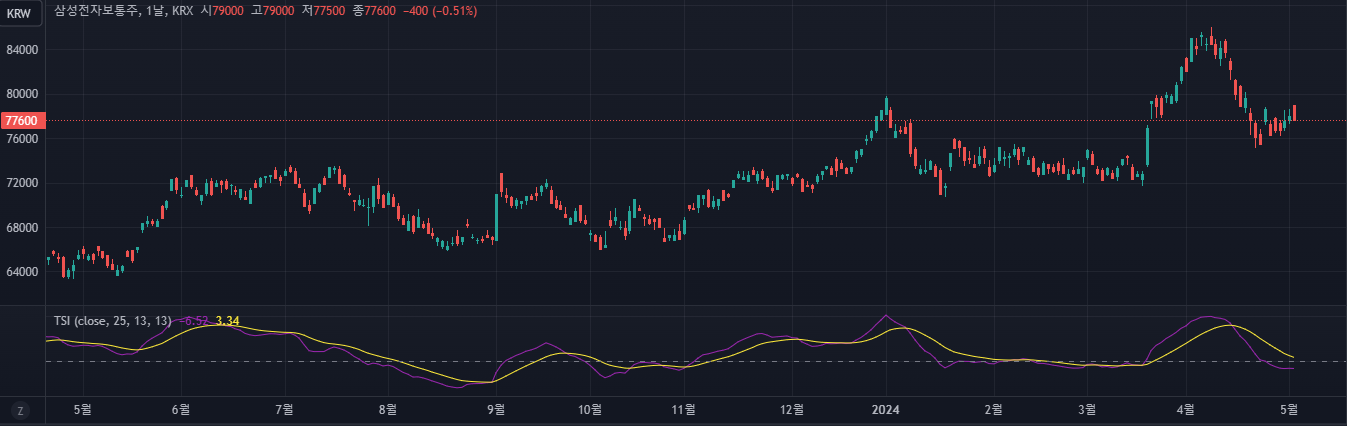
트루 스트랭스 인덱스(TSI, True Strength Index)는 윌리엄 블라우(William Blau)라는 사람에 의해 만들어졌다. TSI는 과거 특정일자의 가격과 현재 가격의 차이를 모멘텀으로 잡고 이 모멘텀을 이중 지수 이동 평균하여 노이즈를 제거한다. 때문에 앞서 보았던 윌리엄의 %R, RSI에 비해 노이즈는 이미 거의 제거된 상태이며, 노이즈가 제거된 TSI를 한번 더 이동평균하여 오실레이터로 사용하기도 한다.
값의 범위는 -100에서 100까지 나올 수 있으나 실제로는 -50, 50을 넘기도 힘들며, 대부분은 값은 -25 ~ 25 사이에 위치한다. 때문에 TSI를 이용한 과매도, 과매수 지점을 -25 ~ 25로 잡고 TSI가 -25를 상향 돌파하면 매수, TSI가 25를 하향 돌파하면 매도의 전략을 취한다.
반응형
트레이딩 뷰 파인 스크립트 소스와 pandas-ta 소스를 공유하며 마친다.
- 트루 스트랭스 인덱스(TSI, True Strength Index) 트레이딩 뷰 파인 스크립트 지표 소스
//@version=5
indicator(title="True Strength Index", shorttitle="TSI", format=format.price, precision=2, timeframe="", timeframe_gaps=true)
import TradingView/ta/7 as ta7
import blackcat1402/pandas_ta/7 as pta

ma(source, length, _type) =>
    switch _type
        "SMA" => ta.sma(source, length)
        "EMA" => ta.ema(source, length)
        "DEMA" => ta7.dema(source,length)
        "TEMA" => ta7.tema(source,length)
        "FRAMA" => ta7.frama(source,length)
        "T3" => ta7.t3(source,length)
        "TRIMA" => ta7.trima(source,length)
        "RMA" => ta.rma(source, length)
        "WMA" => ta.wma(source, length)
        "HMA" => ta.hma(source, length)
        "VWMA" => ta.vwma(source * volume, length)
        "ALMA" => pta.alma(source, length)
        "JMA" => pta.jma(source, length)
        "SINWMA" => pta.sinwma(source, length)
        "FWMA" => pta.fwma(source, length)
        "LINREG" => pta.linreg(source, length)
        "SWMA" => pta.swma(source)
        "YIDYA" => pta.vidya(source, length)
        "VWAP" => pta.vwap(source)
        "ZLMA" => pta.zlma(source, length)

sourceInput = input.source(close, "Source")
longLengthInput = input(title="Long Length", defval=25)
shortLengthInput = input(title="Short Length", defval=13)
maTypeInput = input.string("EMA", title="MA Type", options = ["SMA", "EMA", "DEMA", "TEMA", "FRAMA", "T3", "TRIMA", "RMA", "WMA", "HMA", "VWMA", "ALMA", "JMA", "SINWMA", "FWMA", "LINREG", "SWMA", "VIDYA", "VWAP", "ZLMA"], group="MA Settings", display = display.data_window)
signalLengthInput = input(title="Signal Length", defval=13, group="MA Settings")
upper = input.int(25, title="Upper", group="Band Settings")
lower = input.int(-25, title="Lower", group="Band Settings")

double_smooth(src, longLength, shortLength) =>
	fist_smooth = ta.ema(src, longLength)
	ta.ema(fist_smooth, shortLength)
pc = ta.change(sourceInput)
double_smoothed_pc = double_smooth(pc, longLengthInput, shortLengthInput)
double_smoothed_abs_pc = double_smooth(math.abs(pc), longLengthInput, shortLengthInput)
tsi = 100 * (double_smoothed_pc / double_smoothed_abs_pc)
tsiMA = ma(tsi, signalLengthInput, maTypeInput)
plot(tsi, title="True Strength Index", color=color.purple)
plot(tsiMA, title="Signal", color=color.yellow)
upperBand = hline(upper, "Upper Band", color=color.gray)
mindBand = hline(0, title="Zero", color=color.gray)
lowerBand = hline(lower, "Lower Band", color=color.gray)
fill(upperBand, lowerBand, color=color.new(color.gray, 80))
- 트루 스트랭스 인덱스(TSI, True Strength Index) 트레이딩 뷰 파인 스크립트 전략 소스
//@version=5
strategy(title="True Strength Index", shorttitle="TSI", margin_long=100, margin_short=100, default_qty_type=strategy.percent_of_equity, default_qty_value=50, commission_type=strategy.commission.percent, commission_value=0.2, pyramiding=0)

import TradingView/ta/7 as ta7
import blackcat1402/pandas_ta/7 as pta

ma(source, length, _type) =>
    switch _type
        "SMA" => ta.sma(source, length)
        "EMA" => ta.ema(source, length)
        "DEMA" => ta7.dema(source,length)
        "TEMA" => ta7.tema(source,length)
        "FRAMA" => ta7.frama(source,length)
        "T3" => ta7.t3(source,length)
        "TRIMA" => ta7.trima(source,length)
        "RMA" => ta.rma(source, length)
        "WMA" => ta.wma(source, length)
        "HMA" => ta.hma(source, length)
        "VWMA" => ta.vwma(source * volume, length)
        "ALMA" => pta.alma(source, length)
        "JMA" => pta.jma(source, length)
        "SINWMA" => pta.sinwma(source, length)
        "FWMA" => pta.fwma(source, length)
        "LINREG" => pta.linreg(source, length)
        "SWMA" => pta.swma(source)
        "YIDYA" => pta.vidya(source, length)
        "VWAP" => pta.vwap(source)
        "ZLMA" => pta.zlma(source, length)

sourceInput = input.source(close, "Source")
longLengthInput = input(title="Long Length", defval=25)
shortLengthInput = input(title="Short Length", defval=13)
maTypeInput = input.string("EMA", title="MA Type", options = ["SMA", "EMA", "DEMA", "TEMA", "FRAMA", "T3", "TRIMA", "RMA", "WMA", "HMA", "VWMA", "ALMA", "JMA", "SINWMA", "FWMA", "LINREG", "SWMA", "VIDYA", "VWAP", "ZLMA"], group="MA Settings", display = display.data_window)
signalLengthInput = input(title="Signal Length", defval=13, group="MA Settings")
upper = input.int(25, title="Upper", group="Band Settings")
lower = input.int(-25, title="Lower", group="Band Settings")
indi = input.string("TSI-Band", title="Strategy Indicator", options = ["TSI-Band", "TSIMA-Band", "TSI-TSIMA"])

double_smooth(src, longLength, shortLength) =>
	fist_smooth = ta.ema(src, longLength)
	ta.ema(fist_smooth, shortLength)
pc = ta.change(sourceInput)
double_smoothed_pc = double_smooth(pc, longLengthInput, shortLengthInput)
double_smoothed_abs_pc = double_smooth(math.abs(pc), longLengthInput, shortLengthInput)
tsi = 100 * (double_smoothed_pc / double_smoothed_abs_pc)
tsiMA = ma(tsi, signalLengthInput, maTypeInput)
plot(tsi, title="True Strength Index", color=color.purple)
plot(tsiMA, title="Signal", color=color.yellow)
upperBand = hline(upper, "Upper Band", color=color.gray)
mindBand = hline(0, title="Zero", color=color.gray)
lowerBand = hline(lower, "Lower Band", color=color.gray)
fill(upperBand, lowerBand, color=color.new(color.gray, 80))

startDate = input.time(defval=timestamp("01 Jan 1970 00:00 +0000"), group = "Test Range")
finishDate = input.time(defval=timestamp("31 Dec 2025 24:00 +0000"), group = "Test Range")
time_condition = time >= startDate and time <= finishDate

if(time_condition)
	if (indi == "TSI-Band")
		if ta.crossover(tsi, lower)
			strategy.entry("매수", strategy.long, oca_type=strategy.oca.cancel, comment="매수")
		if ta.crossunder(tsi, upper)
			strategy.close_all('매도')
	if (indi == "TSIMA-Band")
		if ta.crossover(tsiMA, lower)
			strategy.entry("매수", strategy.long, oca_type=strategy.oca.cancel, comment="매수")
		if ta.crossunder(tsiMA, upper)
			strategy.close_all('매도')
	if (indi == "TSI-TSIMA")
		if ta.crossover(tsi, tsiMA)
			strategy.entry("매수", strategy.long, oca_type=strategy.oca.cancel, comment="매수")
		if ta.crossunder(tsi, tsiMA)
			strategy.close_all('매도')

bgcolor(strategy.position_size > 0 ? color.new(color.yellow,90) : na)
- 트루 스트랭스 인덱스(TSI, True Strength Index) pandas-ta 소스
import pandas as pd
import pandas_ta as ta
import FinanceDataReader as fdr

data = fdr.DataReader('005930')
tsi = ta.tsi(close=data['Close'], fast=13, slow=25, signal=13, mamode='EMA')
data = pd.concat([data, tsi], axis=1)
data.dropna(inplace=True)
반응형