

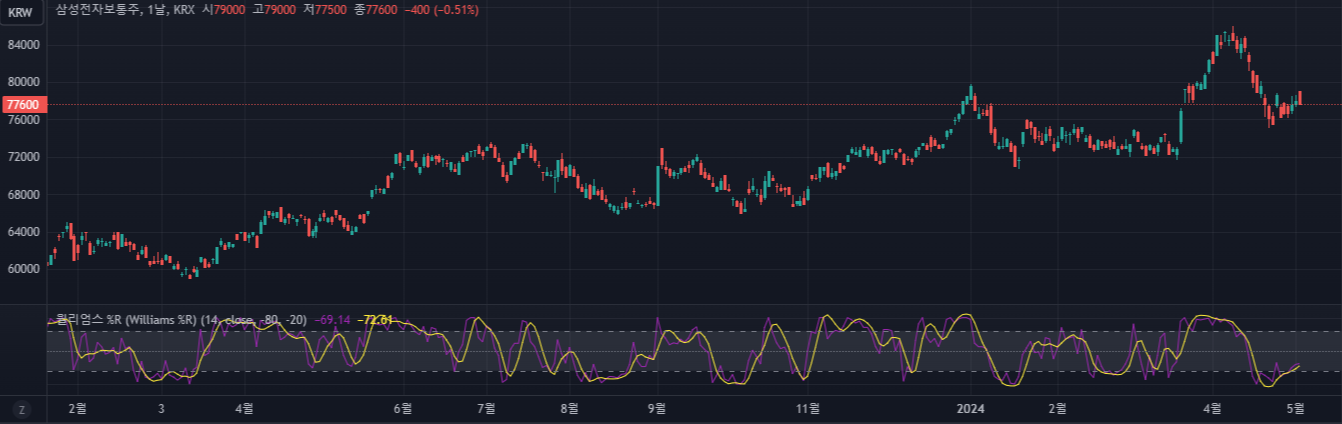
이번에 살펴보는 보조지표는 윌리엄의 %R, WILLR이다. 윌리엄의 퍼센트 범위는 상대 강도 지수(RSI, Relative Strength Index)와 유사하게 과매수, 과매도를 측정하기에 아주 좋은 모멘텀 지표이다. 이 지표는 상품 선물 트레이더였던 래리 윌리엄스(Larry Williams)가 만들었으며 스토캐스틱 패스트(Stochastic Fast)처럼 관찰 구간 내 최저가와 최고가 사이에 종가의 위치를 측정한다. 래리 윌리엄스는 0부터 100까지를 값의 구간으로 사용하였으나 요즘은 -100에서 0까지 구간을 놓고 사용하는 경우가 많다.(아마 스토캐스틱과 기준이 반대이다 보니 값의 범위도 반대로 설정한 게 아닐까 한다.) 통상 14일을 구간으로 잡고 사용하는데 0일 경우, 14일 간 최저가라고 보면 되고, 100일 경우, 14일 간 최고가라고 보면 된다.
가장 비슷한 보조지표는 스토캐스틱 패스트인데, 스토캐스틱 패스트는 저가와 종가 사이의 거리를 측정하고 윌리엄의 %R은 고가와 종가 사이의 거리를 측정하는 것이 차이점이다. -80을 상향 돌파하면 매수, -20을 하향 돌파하면 매도하는 전략을 취하는데, 단점이라면 지표가 너무나 민감하다 보니 그대로 적용하면 거래가 너무 잦거나 너무 빠르게 매수, 매도 포지션을 취하는 경우가 자주 발생한다. 너무 민감하면 RSI처럼 이동 평균을 적용하면 될 일인데 그렇게 쓰지 않는 이유는 이동 평균을 적용하여 래깅이 발생하는 경우에 수익률이 더 떨어지는 결과를 자주 보이기 때문이다. 내가 제공하는 소스에는 윌리엄의 %R과 이것의 이동 평균값을 이용한 매매 전략을 모두 테스트해 볼 수 있게 제공할 테니 각자 테스트하면서 왜 이동평균을 잘 적용하지 않는지 확인해 보면 되겠다. (실제로 값이 민감하다 보니, 내일의 가격변화와 지표의 상관 계수가 상당히 높은 지표이다.)
래리 윌리엄스의 경우에도 단순히 -80, -20의 기준 외에 추가적인 룰을 적용해서 매수, 매도 시점을 잡았는데, 대표적인 게, '-100에 도달 후 5일 내에 -95 ~ -85 이상 상승하면 매수한다.', '0에 도달 후 5일 내에 -5 ~ -15 이하로 떨어지면 매도한다.' 등으로 본인 역시 민감한 지표이다 보니 허위 시그널을 제거하기 위해 노력했던 것 같다.
윌리엄의 퍼센트 범위 (WILLR, William's %R, William's Percent Range) 소스를 이동 평균과 함께 공유한다.
- 윌리엄의 퍼센트 범위 (WILLR, William's %R, William's Percent Range) 파인 스크립트 트레이딩 뷰 지표 소스
//@version=5
indicator("Williams Percent Range", shorttitle="Williams %R", format=format.price, precision=2, timeframe="", timeframe_gaps=true)
import TradingView/ta/7 as ta7
import blackcat1402/pandas_ta/7 as pta

ma(source, length, _type) =>
    switch _type
        "SMA" => ta.sma(source, length)
        "EMA" => ta.ema(source, length)
        "DEMA" => ta7.dema(source,length)
        "TEMA" => ta7.tema(source,length)
        "FRAMA" => ta7.frama(source,length)
        "T3" => ta7.t3(source,length)
        "TRIMA" => ta7.trima(source,length)
        "RMA" => ta.rma(source, length)
        "WMA" => ta.wma(source, length)
        "HMA" => ta.hma(source, length)
        "VWMA" => ta.vwma(source * volume, length)
        "ALMA" => pta.alma(source, length)
        "JMA" => pta.jma(source, length)
        "SINWMA" => pta.sinwma(source, length)
        "FWMA" => pta.fwma(source, length)
        "LINREG" => pta.linreg(source, length)
        "SWMA" => pta.swma(source)
        "YIDYA" => pta.vidya(source, length)
        "VWAP" => pta.vwap(source)
        "ZLMA" => pta.zlma(source, length)

lengthInput = input(title="Length", defval=14)
src = input(close, "Source")
maTypeInput = input.string("SMA", title="MA Type", options = ["SMA", "EMA", "DEMA", "TEMA", "FRAMA", "T3", "TRIMA", "RMA", "WMA", "HMA", "VWMA", "ALMA", "JMA", "SINWMA", "FWMA", "LINREG", "SWMA", "VIDYA", "VWAP", "ZLMA"], group="MA Settings", display = display.data_window)
maLengthInput = input.int(14, title="MA Length", group="MA Settings", display = display.data_window)
lower = input.int(-80, title="Lower", group="Band Settings")
upper = input.int(-20, title="Upper", group="Band Settings")

_pr(length) =>
	max = ta.highest(length)
	min = ta.lowest(length)
	100 * (src - max) / (max - min)
percentR = _pr(lengthInput)
percentRMA = ma(percentR, maLengthInput, maTypeInput)

obPlot = hline(upper, title="Upper Band", color=color.gray)
hline(-50, title="Middle Level", linestyle=hline.style_dotted, color=color.gray)
osPlot = hline(lower, title="Lower Band", color=color.gray)
fill(obPlot, osPlot, title="Background", color=color.new(color.gray, 80))
plot(percentR, title="%R", color=color.purple)
plot(percentRMA, "percentR MA", color=color.yellow)
- 윌리엄의 퍼센트 범위 (WILLR, William's %R, William's Percent Range) 파인 스크립트 트레이딩 뷰 전략 소스
//@version=5
strategy(title="Williams Percent Range", shorttitle="Williams %R", margin_long=100, margin_short=100, default_qty_type=strategy.percent_of_equity, default_qty_value=50, commission_type=strategy.commission.percent, commission_value=0.2, pyramiding=0)

import TradingView/ta/7 as ta7
import blackcat1402/pandas_ta/7 as pta

ma(source, length, _type) =>
    switch _type
        "SMA" => ta.sma(source, length)
        "EMA" => ta.ema(source, length)
        "DEMA" => ta7.dema(source,length)
        "TEMA" => ta7.tema(source,length)
        "FRAMA" => ta7.frama(source,length)
        "T3" => ta7.t3(source,length)
        "TRIMA" => ta7.trima(source,length)
        "RMA" => ta.rma(source, length)
        "WMA" => ta.wma(source, length)
        "HMA" => ta.hma(source, length)
        "VWMA" => ta.vwma(source * volume, length)
        "ALMA" => pta.alma(source, length)
        "JMA" => pta.jma(source, length)
        "SINWMA" => pta.sinwma(source, length)
        "FWMA" => pta.fwma(source, length)
        "LINREG" => pta.linreg(source, length)
        "SWMA" => pta.swma(source)
        "YIDYA" => pta.vidya(source, length)
        "VWAP" => pta.vwap(source)
        "ZLMA" => pta.zlma(source, length)

lengthInput = input(title="Length", defval=14)
src = input(close, "Source")
maTypeInput = input.string("SMA", title="MA Type", options = ["SMA", "EMA", "DEMA", "TEMA", "FRAMA", "T3", "TRIMA", "RMA", "WMA", "HMA", "VWMA", "ALMA", "JMA", "SINWMA", "FWMA", "LINREG", "SWMA", "VIDYA", "VWAP", "ZLMA"], group="MA Settings", display = display.data_window)
maLengthInput = input.int(14, title="MA Length", group="MA Settings", display = display.data_window)
lower = input.int(-80, title="Lower", group="Band Settings")
upper = input.int(-20, title="Upper", group="Band Settings")
indi = input.string("%R", title="Strategy Indicator", options = ["%R", "%R MA"])

_pr(length) =>
	max = ta.highest(length)
	min = ta.lowest(length)
	100 * (src - max) / (max - min)
percentR = _pr(lengthInput)
percentRMA = ma(percentR, maLengthInput, maTypeInput)

obPlot = hline(upper, title="Upper Band", color=color.gray)
hline(-50, title="Middle Level", linestyle=hline.style_dotted, color=color.gray)
osPlot = hline(lower, title="Lower Band", color=color.gray)
fill(obPlot, osPlot, title="Background", color=color.new(color.gray, 80))
plot(percentR, title="%R", color=color.purple)
plot(percentRMA, "percentR MA", color=color.yellow)

startDate = input.time(defval=timestamp("01 Jan 1970 00:00 +0000"), group = "Test Range")
finishDate = input.time(defval=timestamp("31 Dec 2025 24:00 +0000"), group = "Test Range")
time_condition = time >= startDate and time <= finishDate

if(time_condition)
    if (indi == "%R")
        if ta.crossunder(percentR, lower)
            strategy.entry("매수", strategy.long, oca_type=strategy.oca.cancel, comment="매수")
        if ta.crossover(percentR, upper)
            strategy.close_all('매도')
    if (indi == "%R MA")
        if ta.crossunder(percentRMA, lower)
            strategy.entry("매수", strategy.long, oca_type=strategy.oca.cancel, comment="매수")
        if ta.crossover(percentRMA, upper)
            strategy.close_all('매도')

bgcolor(strategy.position_size > 0 ? color.new(color.yellow,90) : na)
- 윌리엄의 퍼센트 범위 (WILLR, William's %R, William's Percent Range) pandas-ta 소스
import pandas as pd
import pandas_ta as ta
import FinanceDataReader as fdr

data = fdr.DataReader('005930')
willr = ta.willr(high = data['High'],low = data['Low'], close = data['Close'], length=14)
data = pd.concat([data, willr], axis=1)
data.dropna(inplace=True)
마지막으로 이 지표를 만든 래리 윌리엄스의 대표적인 저서 하나를 소개하며 마친다.

장단기 투자의 비밀 개정판
COUPANG
www.coupang.com
"이 포스팅은 쿠팡 파트너스 활동의 일환으로, 이에 따른 일정액의 수수료를 제공받습니다."