

이번에 소개하는 지표는 그 유명한 상대 강도 지수 (RSI, Relative Strength Index) 되시겠다. 이 지표를 만든 사람은 존 웰스 와일더 (John Wells Wilder)는 RSI 외에도 평균 방향 지수(ADR, Average Directional Index), 파라볼릭 SAR(Parabolic Stop and Reverse), 그리고 일전에 소개했던 ATR(Average True Range) 등을 만든 기본적 지표 제작자로 유명한 사람이다. 상대 강도 지수는 우리나라보다 미국 등 서방에서 더 유명하고 많이 사용되는 지표로 승률로만 따지만 무시무시한 승률을 자랑한다.
RSI은 대표적인 모멘텀 지표이고 과매수, 과매도 구간을 측정하는데 아주 유용하게 사용된다. RSI는 종가를 전일과 비교하여 상승한 것을 따로 모으고 전일과 비교하여 하락한 것을 따로 모아 RMA(Wilder Moving Average)로 값을 평탄화시킨다. (이동평균의 이름을 보면 알겠으나 와일더 이동 평균은 RSI를 만든 웰스 와일더가 만든 거다. 요즘은 RMA 말고 EMA(지수 이동 평균)이나 다른 이동 평균을 사용하기도 한다. 그 후, 상승 분을 상승+하락 분으로 나눈다. 이 비율로 상대적인 강도를 지수화하는 건데, 기본적인 사상은 모멘텀 지표와 비슷하게 좋은 주식은 상승한 것을 모은 개수와 그 폭이 더 많다는 것이다. 그래서 모멘텀이 좋은 종목은 강도가 높게 나오고 모멘텀이 안 좋은 종목은 강도가 낮게 나온다. (근데 현대에는 RSI가 높은 종목을 과매수, RSI가 낮은 종목을 과매도로 판단하는데 많이 사용한다.) 단, 이 상태로 바로 사용하진 않고 각 일자별 RSI를 이동평균하여 그 값을 사용하는데 이동평균 기간은 보통 14일을 많이 사용한다.
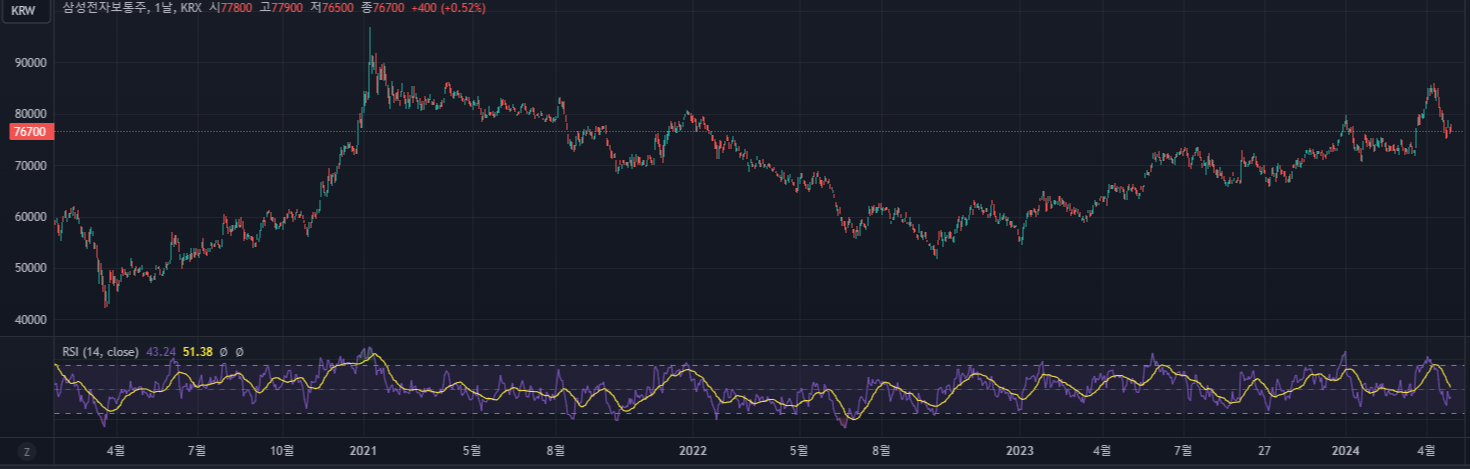
이렇게 구한 RSI가 통상 30 이하로 떨어지면 과매도, 70 이상으로 올라가면 과매수로 보고 각각 매수, 매도에 진입한다. 이 전략은 해외에서 엄청나게 유행했고 아직도 많이 연구되고 있는 전략으로 적당히 좋은 종목만 고른다면 승률이 굉장히 좋다. 단, 보면 알겠지만 저 노란색 이동평균이 평균 구간인 30~70 외로 벗어나는 경우가 많지 않다. 따라서 이 전략을 적용하면 보유 구간이 상당히 길어진다. 일단 승률이 높다 보니 대부분이 수익 팩터, sharp ratio 등 평가 지표에서 제법 좋은 점수를 받고 그렇다 보니 더 주목을 받는 듯한 지표이고 전략이다.
구간을 25~75, 20~80 등 조정하는 경우도 많고 이동평균과 일별 강도 지수 간 교차를 이용하여 거래전략을 만드는 경우도 있다. 심지어 일별 강도 지수에 볼린저 밴드를 적용하는 등 다른 보조지표를 이 RSI에 씌워 사용하는 등 워낙 유명한 지표이다 보니 다양한 베리에이션들이 존재하며 지속적으로 개발되고 있는데, 이런 것들은 이어서 소개해보도록 하겠다.
이제 트레이딩 뷰 파인 스크립트 소스와 pandas-ta 소스를 공유한다.
- 상대 강도 지수 (RSI, Relative Strength Index) 트레이딩 뷰 파인 스크립트 지표 소스
//@version=5
indicator(title="Relative Strength Index", shorttitle="RSI", format=format.price, precision=2, timeframe="", timeframe_gaps=true)
import TradingView/ta/7 as ta7
import blackcat1402/pandas_ta/7 as pta

ma(source, length, _type) =>
    switch _type
        "SMA" => ta.sma(source, length)
        "EMA" => ta.ema(source, length)
        "DEMA" => ta7.dema(source,length)
        "TEMA" => ta7.tema(source,length)
        "FRAMA" => ta7.frama(source,length)
        "T3" => ta7.t3(source,length)
        "TRIMA" => ta7.trima(source,length)
        "RMA" => ta.rma(source, length)
        "WMA" => ta.wma(source, length)
        "HMA" => ta.hma(source, length)
        "VWMA" => ta.vwma(source * volume, length)
        "ALMA" => pta.alma(source, length)
        "JMA" => pta.jma(source, length)
        "SINWMA" => pta.sinwma(source, length)
        "FWMA" => pta.fwma(source, length)
        "LINREG" => pta.linreg(source, length)
        "SWMA" => pta.swma(source)
        "YIDYA" => pta.vidya(source, length)
        "VWAP" => pta.vwap(source)
        "ZLMA" => pta.zlma(source, length)

rsiLengthInput = input.int(14, minval=1, title="RSI Length", group="RSI Settings")
rsiSourceInput = input.source(close, "Source", group="RSI Settings")
maTypeInput = input.string("SMA", title="MA Type", options = ["SMA", "EMA", "DEMA", "TEMA", "FRAMA", "T3", "TRIMA", "RMA", "WMA", "HMA", "VWMA", "ALMA", "JMA", "SINWMA", "FWMA", "LINREG", "SWMA", "VIDYA", "VWAP", "ZLMA"], group="MA Settings", display = display.data_window)
maLengthInput = input.int(14, title="MA Length", group="MA Settings", display = display.data_window)
lower = input.int(30, title="Lower", group="Band Settings")
upper = input.int(70, title="Upper", group="Band Settings")

up = ta.rma(math.max(ta.change(rsiSourceInput), 0), rsiLengthInput)
down = ta.rma(-math.min(ta.change(rsiSourceInput), 0), rsiLengthInput)
rsi = down == 0 ? 100 : up == 0 ? 0 : 100 - (100 / (1 + up / down))
rsiMA = ma(rsi, maLengthInput, maTypeInput)

rsiPlot = plot(rsi, "RSI", color=color.purple)
plot(rsiMA, "RSI-based MA", color=color.yellow)
rsiUpperBand = hline(upper, "RSI Upper Band", color=color.gray)
midline = hline(50, "RSI Middle Band", color=color.gray)
rsiLowerBand = hline(lower, "RSI Lower Band", color=color.gray)
fill(rsiUpperBand, rsiLowerBand, color=color.new(color.gray, 80), title="RSI Background Fill")
- 상대 강도 지수 (RSI, Relative Strength Index) 트레이딩 뷰 파인 스크립트 전략 소스
//@version=5
strategy(title="Relative Strength Index", shorttitle="RSI", overlay=false, margin_long=100, margin_short=100, default_qty_type=strategy.percent_of_equity, default_qty_value=50, commission_type=strategy.commission.percent, commission_value=0.2, pyramiding=0)
import TradingView/ta/7 as ta7
import blackcat1402/pandas_ta/7 as pta

ma(source, length, _type) =>
    switch _type
        "SMA" => ta.sma(source, length)
        "EMA" => ta.ema(source, length)
        "DEMA" => ta7.dema(source,length)
        "TEMA" => ta7.tema(source,length)
        "FRAMA" => ta7.frama(source,length)
        "T3" => ta7.t3(source,length)
        "TRIMA" => ta7.trima(source,length)
        "RMA" => ta.rma(source, length)
        "WMA" => ta.wma(source, length)
        "HMA" => ta.hma(source, length)
        "VWMA" => ta.vwma(source * volume, length)
        "ALMA" => pta.alma(source, length)
        "JMA" => pta.jma(source, length)
        "SINWMA" => pta.sinwma(source, length)
        "FWMA" => pta.fwma(source, length)
        "LINREG" => pta.linreg(source, length)
        "SWMA" => pta.swma(source)
        "YIDYA" => pta.vidya(source, length)
        "VWAP" => pta.vwap(source)
        "ZLMA" => pta.zlma(source, length)

rsiLengthInput = input.int(14, minval=1, title="RSI Length", group="RSI Settings")
rsiSourceInput = input.source(close, "Source", group="RSI Settings")
maTypeInput = input.string("SMA", title="MA Type", options = ["SMA", "EMA", "DEMA", "TEMA", "FRAMA", "T3", "TRIMA", "RMA", "WMA", "HMA", "VWMA", "ALMA", "JMA", "SINWMA", "FWMA", "LINREG", "SWMA", "VIDYA", "VWAP", "ZLMA"], group="MA Settings", display = display.data_window)
maLengthInput = input.int(14, title="MA Length", group="MA Settings", display = display.data_window)
lower = input.int(30, title="Lower", group="Band Settings")
upper = input.int(70, title="Upper", group="Band Settings")


up = ta.rma(math.max(ta.change(rsiSourceInput), 0), rsiLengthInput)
down = ta.rma(-math.min(ta.change(rsiSourceInput), 0), rsiLengthInput)
rsi = down == 0 ? 100 : up == 0 ? 0 : 100 - (100 / (1 + up / down))
rsiMA = ma(rsi, maLengthInput, maTypeInput)

rsiPlot = plot(rsi, "RSI", color=color.purple)
plot(rsiMA, "RSI-based MA", color=color.yellow)
rsiUpperBand = hline(upper, "RSI Upper Band", color=color.gray)
midline = hline(50, "RSI Middle Band", color=color.gray)
rsiLowerBand = hline(lower, "RSI Lower Band", color=color.gray)
fill(rsiUpperBand, rsiLowerBand, color=color.new(color.gray, 80), title="RSI Background Fill")

startDate = input.time(defval=timestamp("01 Jan 1970 00:00 +0000"), group = "Test Range")
finishDate = input.time(defval=timestamp("31 Dec 2025 24:00 +0000"), group = "Test Range")
time_condition = time >= startDate and time <= finishDate

if(time_condition)
	if ta.crossunder(rsiMA, lower)
		strategy.entry("매수", strategy.long, oca_type=strategy.oca.cancel, comment="매수")
	if ta.crossover(rsiMA, upper)
		strategy.close_all('매도')

bgcolor(strategy.position_size > 0 ? color.new(color.yellow,90) : na)
- 상대 강도 지수 (RSI, Relative Strength Index) pandas-ta 소스
import pandas as pd
import pandas_ta as ta
import FinanceDataReader as fdr

data = fdr.DataReader('005930')
rsi = ta.rsi(close = data['Close'], length=14)
data = pd.concat([data, rsi], axis=1)
data.dropna(inplace=True)