

반응형
이번엔 변동성 지표 중 가속 밴드라고 하는 걸 살펴본다. 이름이 밴드인 만큼 앞서 소개했던 엔벨롭, 볼린저 밴드, 켈트너 채널과 모양은 유사하다. 이 중 개념적으로나 결과적으로 가장 유사한 것은 켈트너 채널(Keltner Channels). 단 가격 밴드를 형성할 때 단순 백분율이 아닌 매 봉의 고가, 저가 차이를 이용한다. 고저가 차이를 구하는 방법은 아래 수식을 참조.

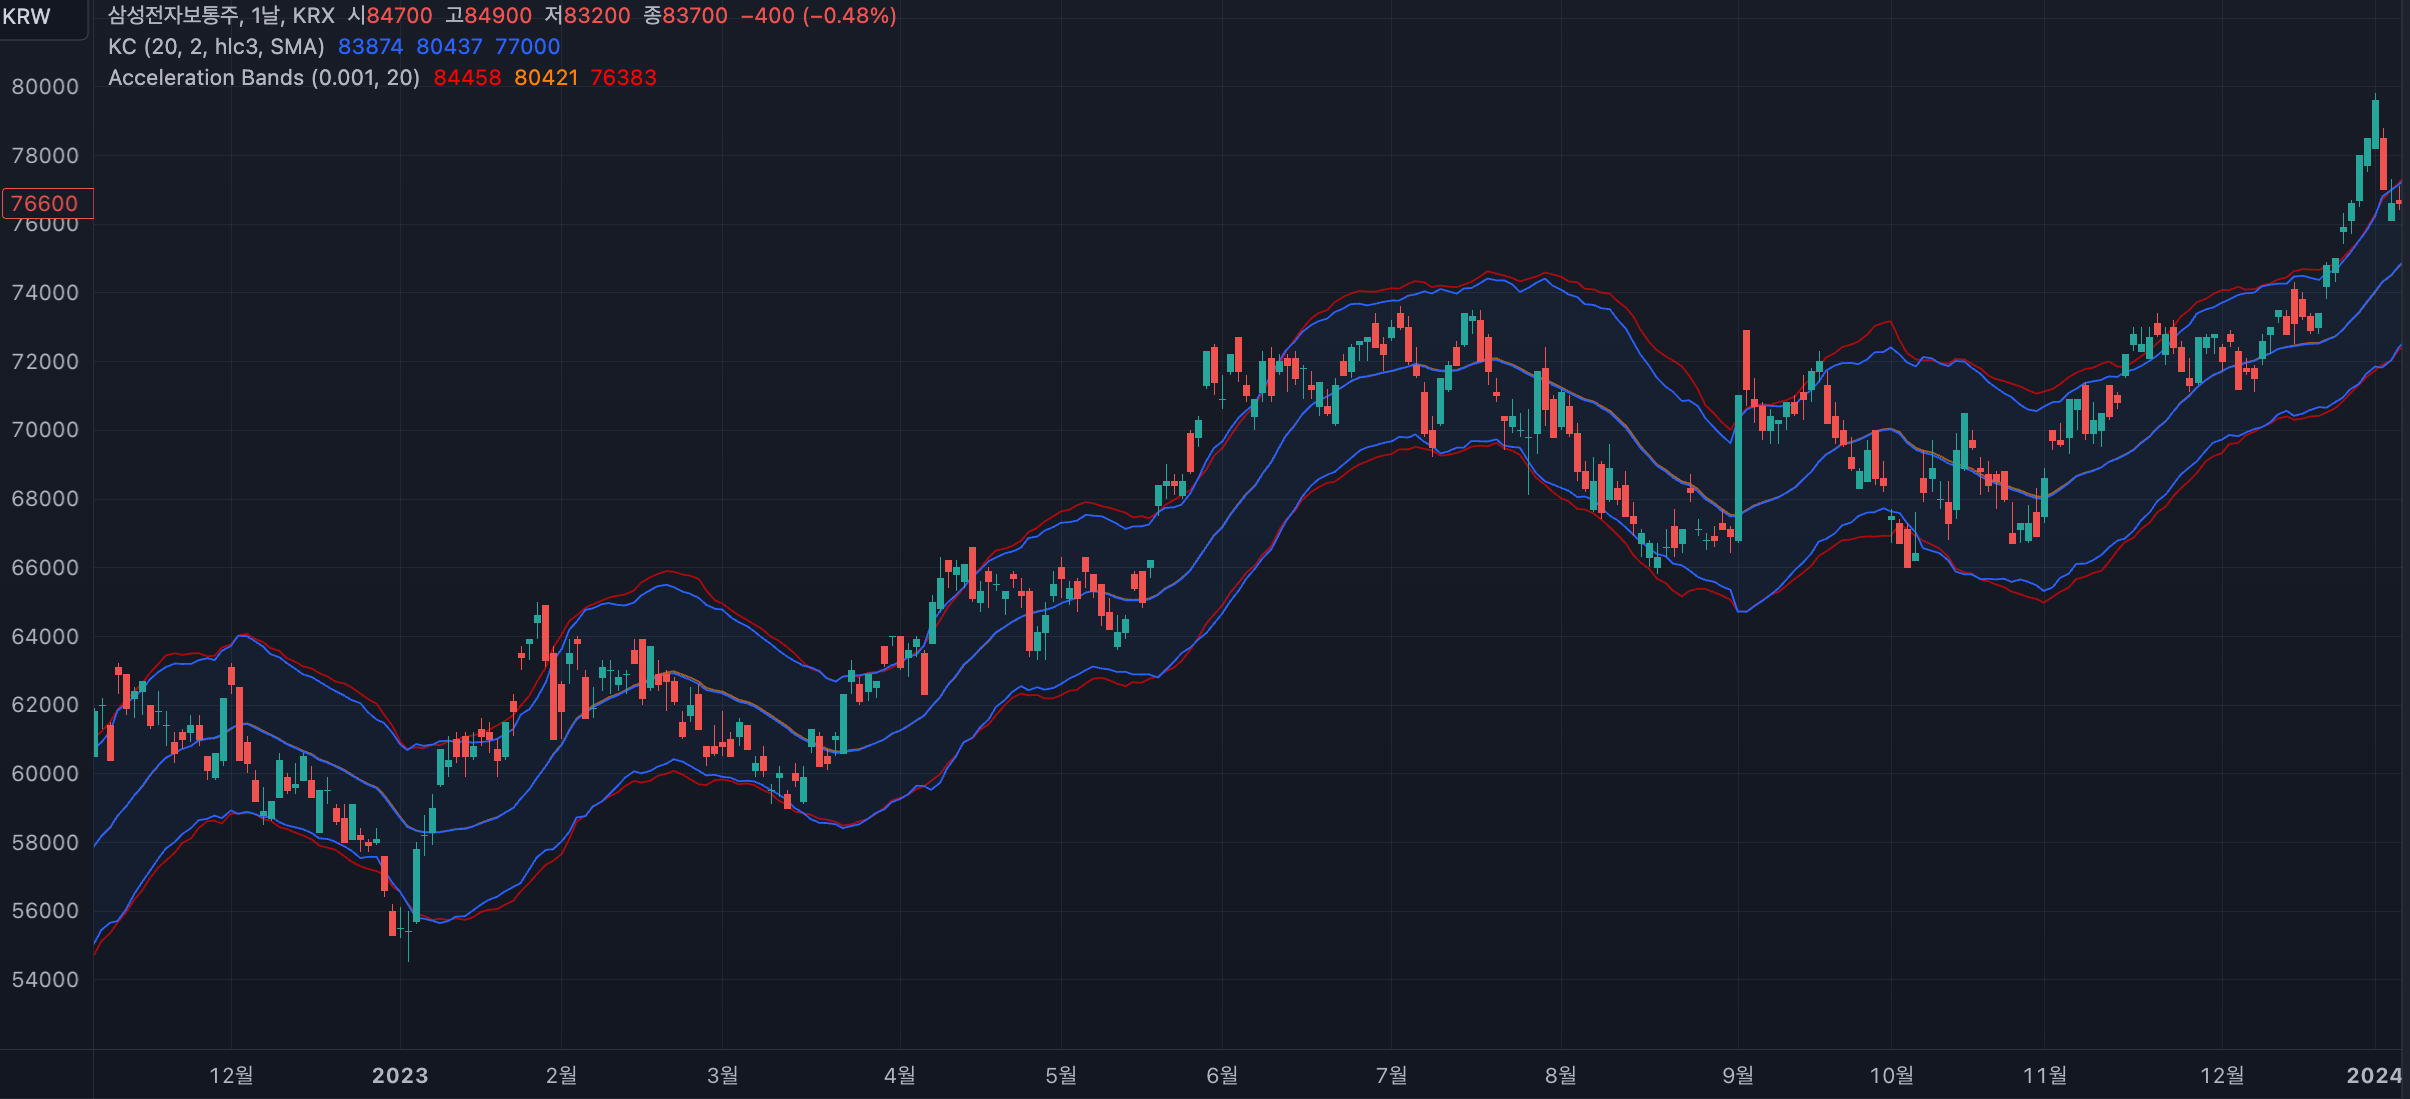
특이한 점은 위아래 밴드에 각각 이동 평균을 먹여 사용한다는 것이다. 그럼 이제 가속 밴드와 캘트너 채널과의 차이를 확인해보자.
반응형
캘트너 채널보다는 좀 더 변동성을 잘 반영하는 듯하다.
가속 밴드도 이동 평균 구간을 조절하거나 밴드의 이동평균 종류를 변경하면서 최적을 찾는 경우가 많다. 기본은 이동평균 은 단순 이동 평균, 이동 평균 구간은 20을 사용한다. 장단점은 기존에 소개 했던 앤벨롭, 볼린저 밴드 그리고 캘트너 채널과 비슷하다. 장단기 추세를 어떻게 반영하여 보완하는지가 이런 변동성 지표를 가장 잘 사용할 수 있는 방법이다.
마지막으로 트레이딩 뷰 파인 스크립트 소스와 pandas-ta 소스를 공유한다.
- 가속 밴드 (Acceleration Bands) 트레이딩 뷰 파인 스크립트 지표 소스
//@version=5
indicator(title="Acceleration Bands", shorttitle="AB", overlay=true, timeframe="", timeframe_gaps=true)
import TradingView/ta/7 as ta7

len = input.int(20, minval=1)
mult = input(2.0, "Multiplier")
maType = input.string("SMA", "MA Type", options = ["SMA", "EMA", "DEMA", "TEMA", "FRAMA", "T3", "TRIMA", "RMA", "WMA", "HMA", "VWMA"])
ma(source, length, _type) =>
    switch _type
        "SMA" => ta.sma(source, length)
        "EMA" => ta.ema(source, length)
        "DEMA" => ta7.dema(source,length)
        "TEMA" => ta7.tema(source,length)
        "FRAMA" => ta7.frama(source,length)
        "T3" => ta7.t3(source,length)
        "TRIMA" => ta7.trima(source,length)
        "RMA" => ta.rma(source, length)
        "WMA" => ta.wma(source, length)
        "HMA" => ta.hma(source, length)
        "VWMA" => ta.vwma(source, length)

upper = high * (1 + (mult * 2 * (high - low) / (high + low) ) )
lower = low * (1 - (mult * 2 * (high - low) / (high + low) ) )

basis = ma(close, len, maType)
upperband = ma(upper, len, maType)
lowerband = ma(lower, len, maType)
u = plot(upperband, color=#2962FF, title="Upper")
plot(basis, color=#2962FF, title="Basis")
l = plot(lowerband, color=#2962FF, title="Lower")
fill(u, l, color=color.rgb(33, 150, 243, 95), title="Background")
- 가속 밴드 (Acceleration Bands) 트레이딩 뷰 파인 스크립트 전략 소스
//@version=5
indicator(title="Acceleration Bands", shorttitle="AB", overlay=true, timeframe="", timeframe_gaps=true)
import TradingView/ta/7 as ta7

len = input.int(20, minval=1)
mult = input(2.0, "Multiplier")
maType = input.string("SMA", "MA Type", options = ["SMA", "EMA", "DEMA", "TEMA", "FRAMA", "T3", "TRIMA", "RMA", "WMA", "HMA", "VWMA"])
ma(source, length, _type) =>
    switch _type
        "SMA" => ta.sma(source, length)
        "EMA" => ta.ema(source, length)
        "DEMA" => ta7.dema(source,length)
        "TEMA" => ta7.tema(source,length)
        "FRAMA" => ta7.frama(source,length)
        "T3" => ta7.t3(source,length)
        "TRIMA" => ta7.trima(source,length)
        "RMA" => ta.rma(source, length)
        "WMA" => ta.wma(source, length)
        "HMA" => ta.hma(source, length)
        "VWMA" => ta.vwma(source, length)

upper = high * (1 + (mult * 2 * (high - low) / (high + low) ) )
lower = low * (1 - (mult * 2 * (high - low) / (high + low) ) )

basis = ma(close, len, maType)
upperband = ma(upper, len, maType)
lowerband = ma(lower, len, maType)
u = plot(upperband, color=#2962FF, title="Upper")
plot(basis, color=#2962FF, title="Basis")
l = plot(lowerband, color=#2962FF, title="Lower")
fill(u, l, color=color.rgb(33, 150, 243, 95), title="Background")
- 가속 밴드 (Acceleration Bands) pandas-ta 소스
import pandas as pd
import pandas_ta as ta
import FinanceDataReader as fdr

data = fdr.DataReader('005930')
accbands = ta.accbands(high=data['High'], low=data['Low'], close=data['Close'], length=20, c=2, mamode='SMA')
data = pd.concat([data, accbands], axis=1)
data.dropna(inplace=True)
반응형