

반응형
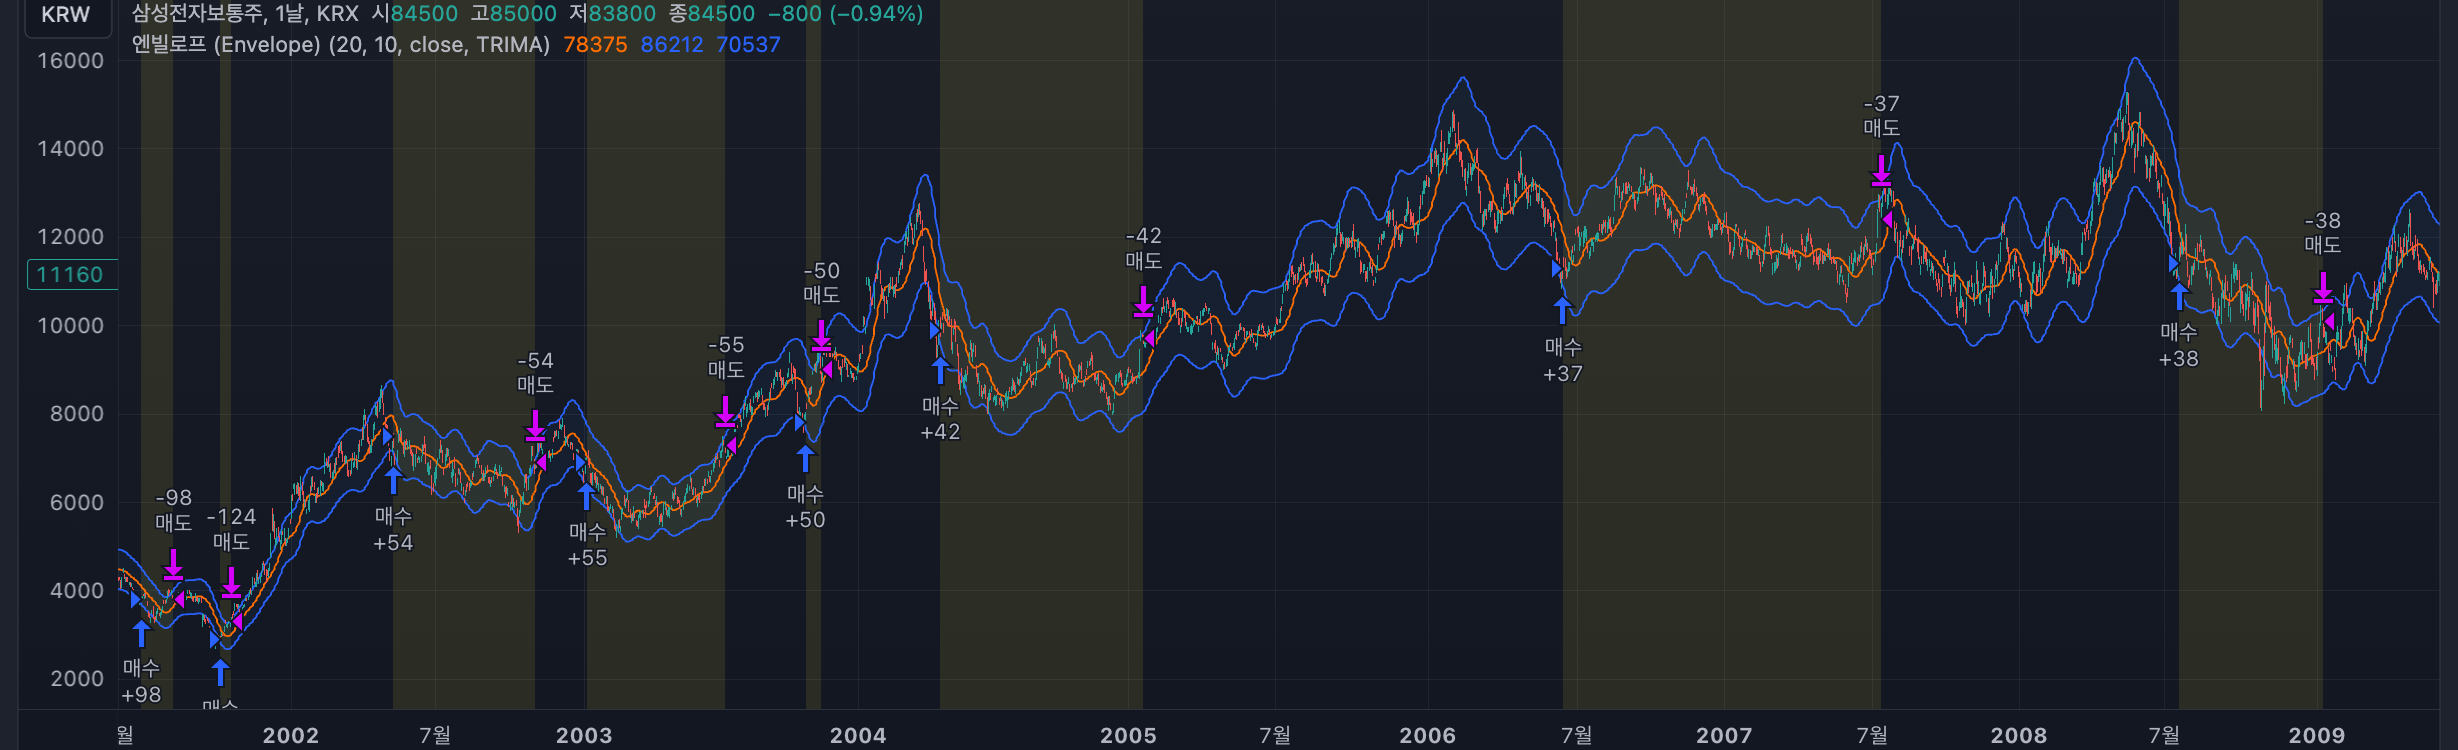
이번에는 엔벨롭 지표와 이를 이용한 매매전략을 다룬다. 엔벨롭은 윌프리드 르두(Wilfrid LeDoux)라는 사람이 만든 아주 간단하게 주식의 과매수, 과매도 구간을 파악할 수 있는 지표다. 이동평균을 이용해 이동평균의 대체적으로 10% 상단과 10% 하단을 표시한다. 현재 가격이 이 이동평균 구간을 기준으로 상단에 위치하면 과매수 구간, 하단에 위치하면 과매도 구간으로 판단한다.
이동평균과 이동평균의 단순 몇%로 밴드를 만들기 때문에 직관적이기는 하나 가격에 대해 후행적이다. 이 때문에 이동평균을 단순이동평균 대신 지수이동평균 등으로 대체하여 사용하거나, 이동평균 범위를 조절하거나, 밴드 범위를 10%에서 조정해서 사용하기도 한다.
매매 전략은 상단 밴드에 다다랐을 때 매도, 하단 밴드에 다다랐을 때 매수하거나 혹은 하단, 상단 밴드에 진입했을 때 각각 매수, 매도를 하는 전략을 사용한다.
마지막으로 트레이딩뷰 파인스크립트 소스와 pandas-ta 소스를 공유하며 끝낸다. 참고로 TA-Lib이나 pandas-ta에는 엔벨롭을 만드는 펑션은 없는 듯. 워낙 간단해서인지..
- 엔벨롭 (Envelope) 트레이딩 뷰 파인 스크립트 지표 소스
//@version=5
indicator(title="Envelope", overlay=true, timeframe="", timeframe_gaps=true)
import TradingView/ta/7 as ta7
len = input.int(20, title="Length", minval=1)
percent = input(10.0)
src = input(close, title="Source")
maType = input.string("SMA", "MA Type", options = ["SMA", "EMA", "DEMA", "TEMA", "FRAMA", "T3", "TRIMA", "RMA", "WMA", "HMA", "VWMA"])
ma(source, length, _type) =>
    switch _type
        "SMA" => ta.sma(source, length)
        "EMA" => ta.ema(source, length)
        "DEMA" => ta7.dema(source,length)
        "TEMA" => ta7.tema(source,length)
        "FRAMA" => ta7.frama(source,length)
        "T3" => ta7.t3(source,length)
        "TRIMA" => ta7.trima(source,length)
        "RMA" => ta.rma(source, length)
        "WMA" => ta.wma(source, length)
        "HMA" => ta.hma(source, length)
        "VWMA" => ta.vwma(source, length)
basis = ma(src, len, maType)

k = percent/100.0
upper = basis * (1 + k)
lower = basis * (1 - k)
plot(basis, "Basis", color=#FF6D00)
u = plot(upper, "Upper", color=#2962FF)
l = plot(lower, "Lower", color=#2962FF)
fill(u, l, color=color.rgb(33, 150, 243, 95), title="Background")
- 엔벨롭 (Envelope) 트레이딩 뷰 파인 스크립트 전략 소스
//@version=5
strategy("Envelope", overlay=true, margin_long=100, margin_short=100, default_qty_type=strategy.percent_of_equity, default_qty_value=50, commission_type=strategy.commission.percent, commission_value=0.2, pyramiding=0)
import TradingView/ta/7 as ta7
len = input.int(20, title="Length", minval=1)
percent = input(10.0)
src = input(close, title="Source")
maType = input.string("SMA", "MA Type", options = ["SMA", "EMA", "DEMA", "TEMA", "FRAMA", "T3", "TRIMA", "RMA", "WMA", "HMA", "VWMA"])
ma(source, length, _type) =>
    switch _type
        "SMA" => ta.sma(source, length)
        "EMA" => ta.ema(source, length)
        "DEMA" => ta7.dema(source,length)
        "TEMA" => ta7.tema(source,length)
        "FRAMA" => ta7.frama(source,length)
        "T3" => ta7.t3(source,length)
        "TRIMA" => ta7.trima(source,length)
        "RMA" => ta.rma(source, length)
        "WMA" => ta.wma(source, length)
        "HMA" => ta.hma(source, length)
        "VWMA" => ta.vwma(source, length)
basis = ma(src, len, maType)

k = percent/100.0
upper = basis * (1 + k)
lower = basis * (1 - k)
plot(basis, "Basis", color=#FF6D00)
u = plot(upper, "Upper", color=#2962FF)
l = plot(lower, "Lower", color=#2962FF)
fill(u, l, color=color.rgb(33, 150, 243, 95), title="Background")

startDate = input.time(defval=timestamp("01 Jan 1970 00:00 +0000"), group = "Test Range")
finishDate = input.time(defval=timestamp("31 Dec 2025 24:00 +0000"), group = "Test Range")
time_condition = time >= startDate and time <= finishDate

if(time_condition)
	if ta.crossover(src, lower)
		strategy.entry("매수", strategy.long, stop=lower, oca_type=strategy.oca.cancel, comment="매수")
	if ta.crossunder(src, upper)
		strategy.close_all('매도')

bgcolor(strategy.position_size > 0 ? color.new(color.yellow,90) : na)
- 엔벨롭 (Envelope) pandas-ta 소스
import pandas_ta as ta
import FinanceDataReader as fdr

data = fdr.DataReader('005930')
data['basis'] = ta.sma(data['Close'], 20)
data['upper'] = data['basis'] + data['basis'] * 0.1
data['lower'] = data['basis'] - data['basis'] * 0.1
data.dropna(inplace=True)
반응형